Social progress is meeting the basic needs of people, delivering a solid foundation of well-being and providing opportunity. More than 70 partners in 45 countries–from the European Commission to the government of India to city leaders in Philadelphia–are using the Social Progress Index to make better decisions to improve people’s lives.
For a decade the Social Progress Index has been deployed at a global, national and local level. Leaders in every sector – government, business and civil society – use it to understand the strengths and vulnerabilities of their communities.
The Social Progress Index is transforming the way governments use data to respond to the needs of people and has become a critical tool for decision-making. Taking a data-driven approach allows for a common understanding of people’s lived realities to enable action, drive change and reach the furthest behind, first.
Usefulness for the SDGs
SPI offers a practical way for policymakers to track and report on progress towards the SDGs in a consistent manner, particularly for governments conducting their Voluntary National Reviews (VNRs). And the SPI framework has been successfully adapted in countries, cities and communities of every size thanks to its ability to incorporate locally-relevant data into each index. This flexibility means the index can be used to localize implementation of the SDGs at a more granular level, where change can happen quickest but formal SDG indicators often unavailable or unreliable.
The index uses 51 indicators drawn from official UN data but also from globally respected research institutions and polling organizations to provide a comprehensive estimate of SDG performance even where the formal indicators do not exist.
Method
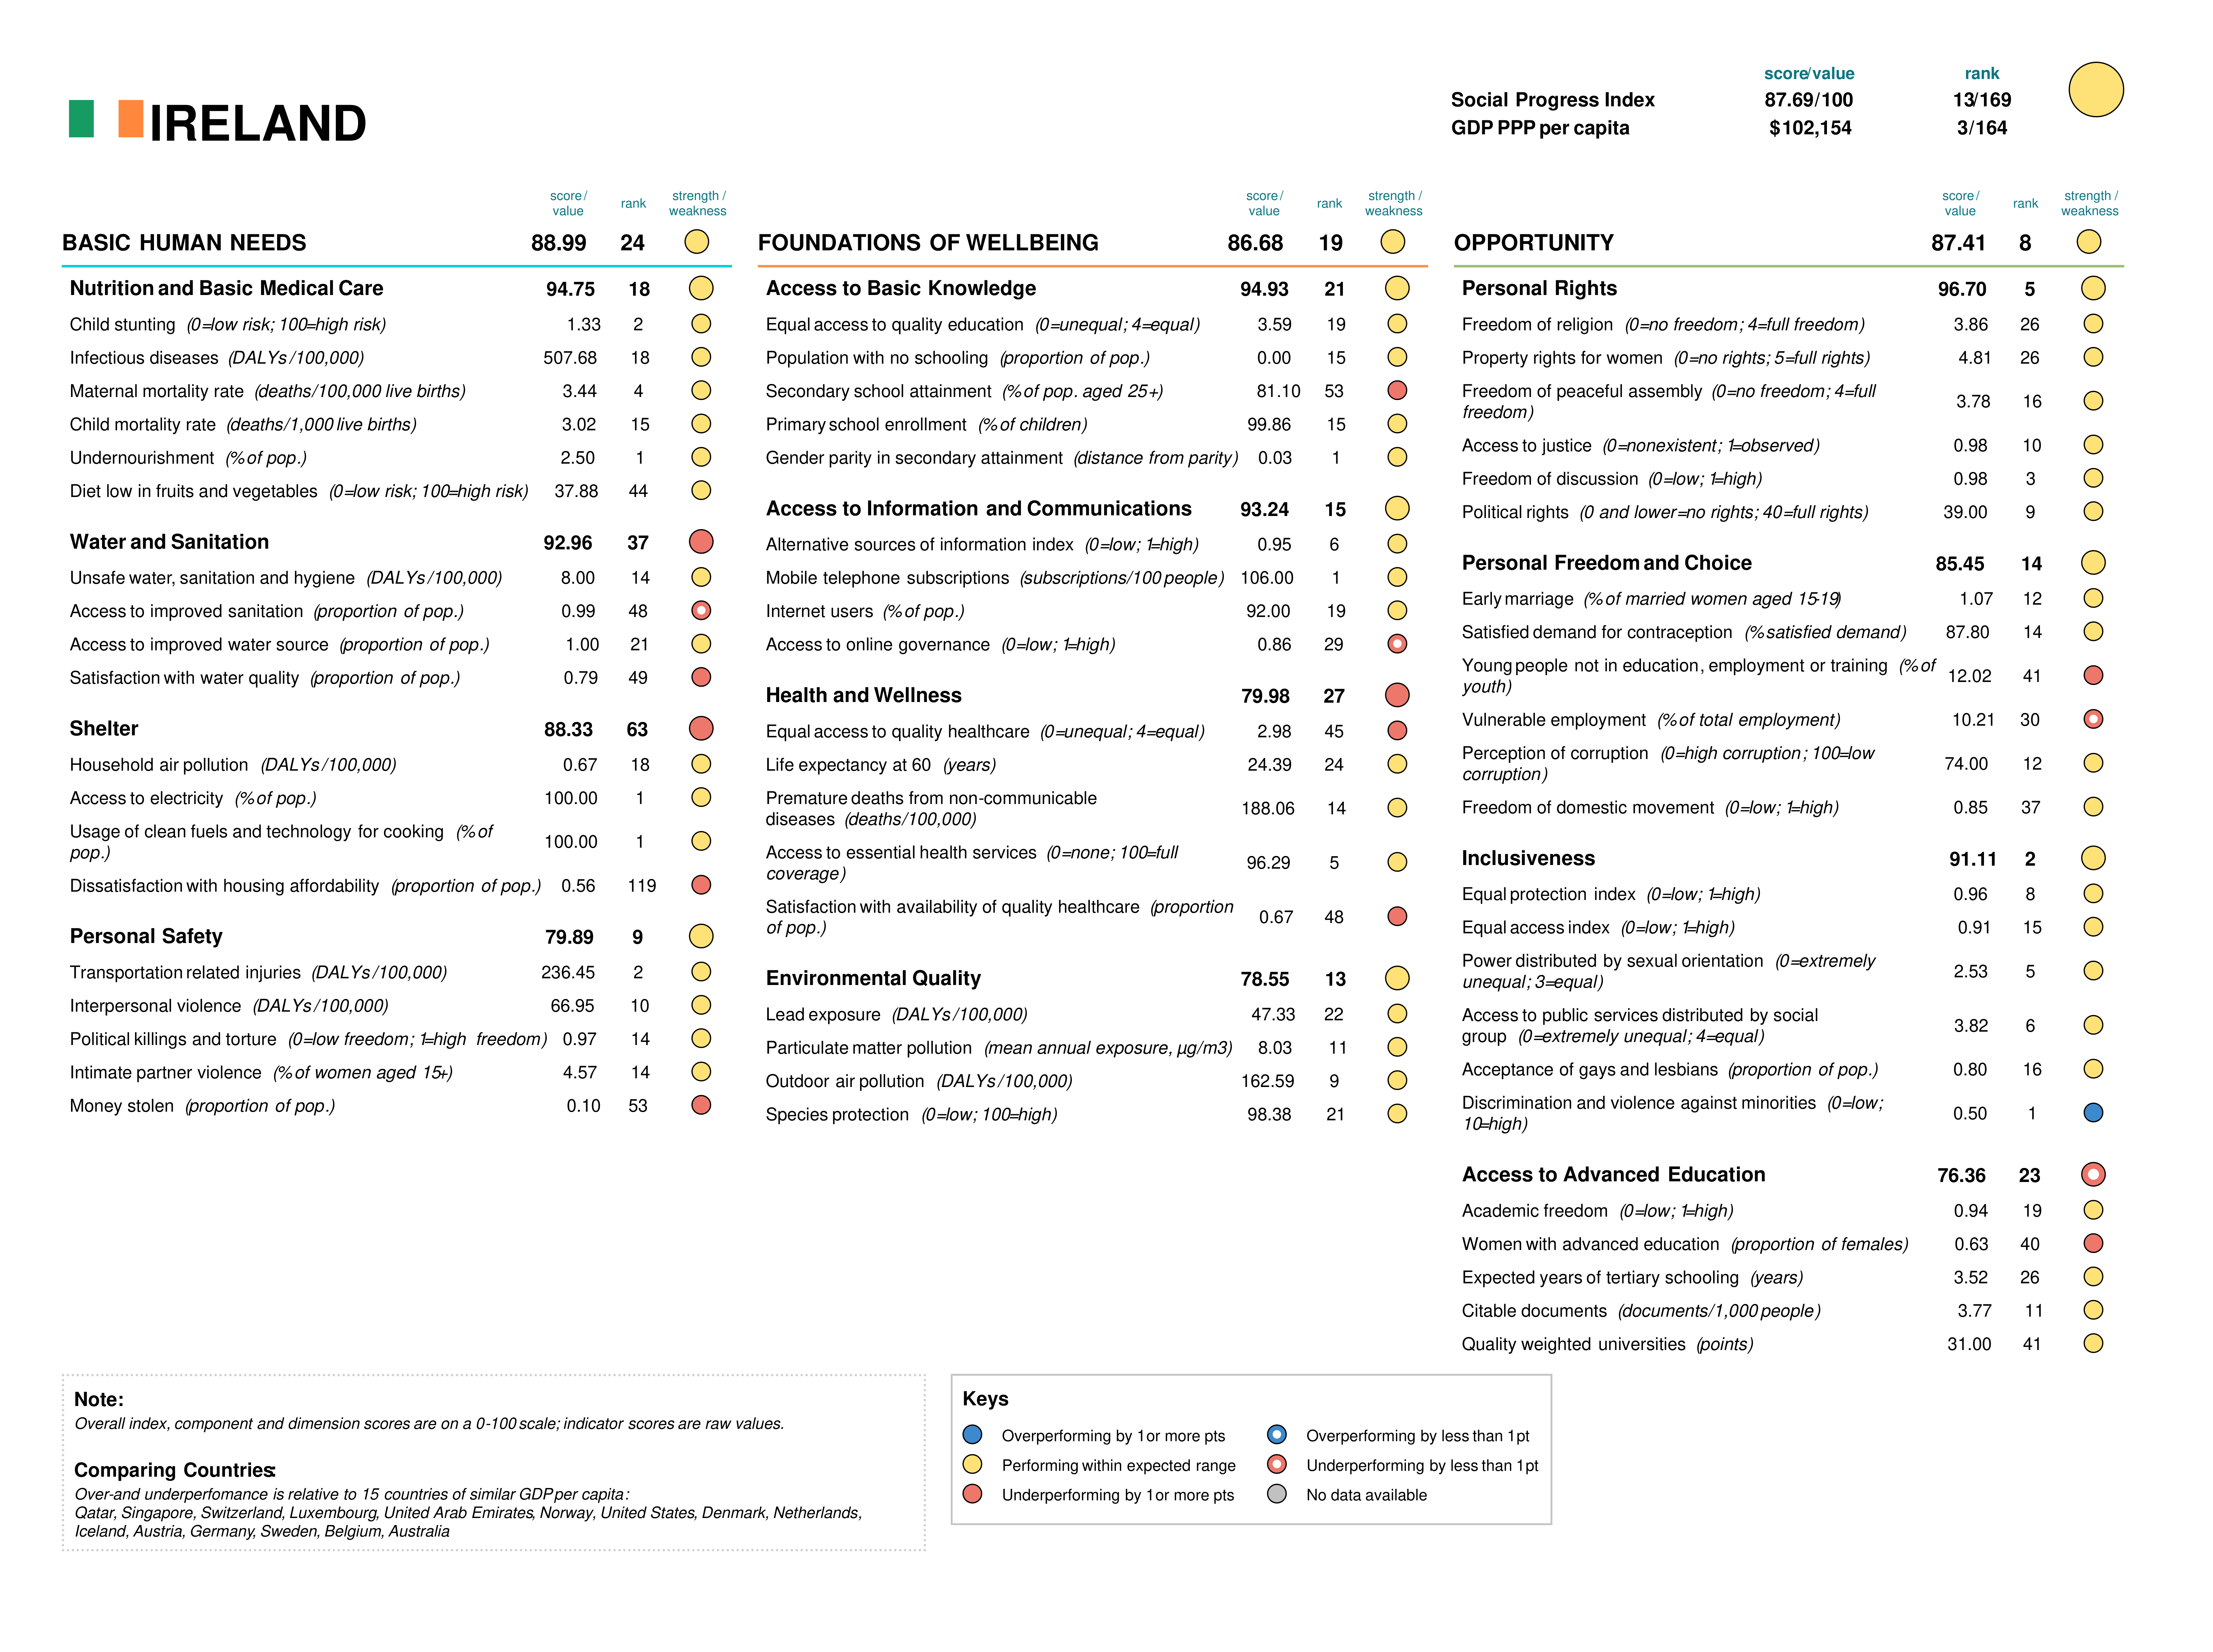
The scorecard highlights a country’s relative strengths and relative weaknesses compared to 15 peer countries with a similar GDP per capita. Elements of the Social Progress Index are marked with a blue dot where the country performs comparatively well, a red dot where it performs relatively poorly, a yellow dot where its performance is average for its peer group, and a gray dot when there isn’t sufficient data to make a judgment. Elements marked with a blue ring are areas where the country slightly over-performs while areas where the country slightly under-performs are marked with a red ring.
For information on how scorecards are calculated, please consult the methodology report.